CollegeLife Project

Project Summary
Personal project to develop in the futureData collections started in May 2021 and ended in March 2022. The data was collected on an excel sheet of every single transaction that I have made and where it came from.
My favorite part of the current collection of data part of the project is when the reflection stage happens at the end of the week so that I can set a budget and see how well I follow it. Well... lets see how I did!

Data Collection and Results
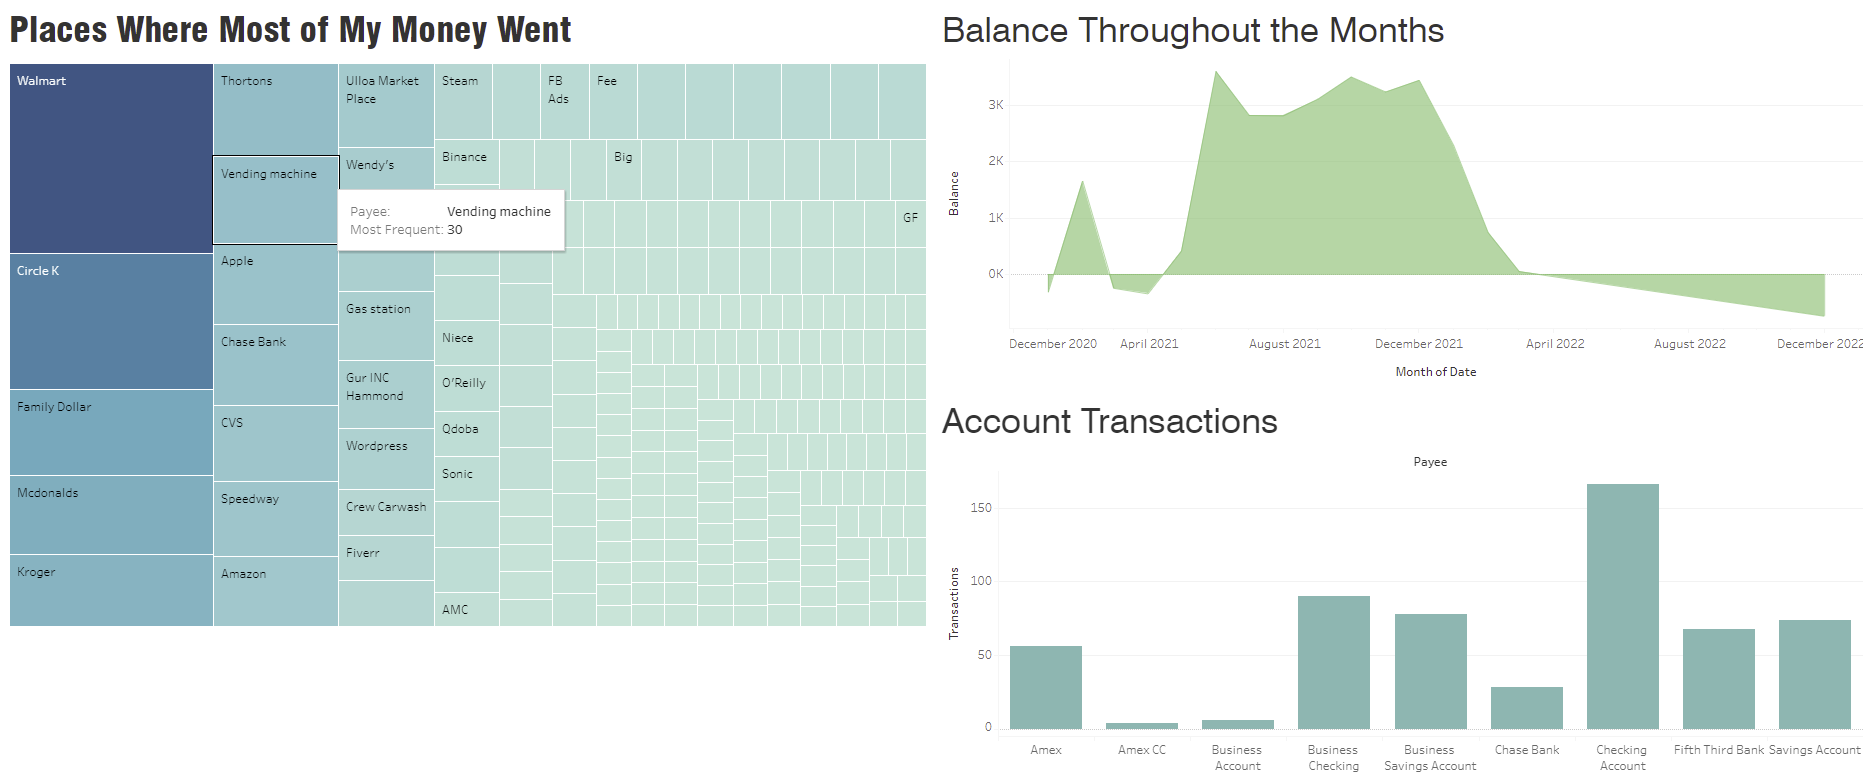
Three subjects explain the entire project. One is where I spent the most money at. I personally know that it was college snacks from Walmart, gas, and slushies! This information also displays how many times I have went their in that current time.
Not only that, but the way that my money went throughout this process. Let's just say that Walmart snacks was between April 2022 and December 2022. Along with this information, there are my account transactions from which account was the most active during these purchases.
This entire project resulted in me being more disciplined with my money and notice my habits of what I buy and where I go to buy it. I distinctively derived my needs and wants after this project. Even though Walamart is tempting, I resulted to spending less and saving more by only going to Walmart when needed.


Process of the Project
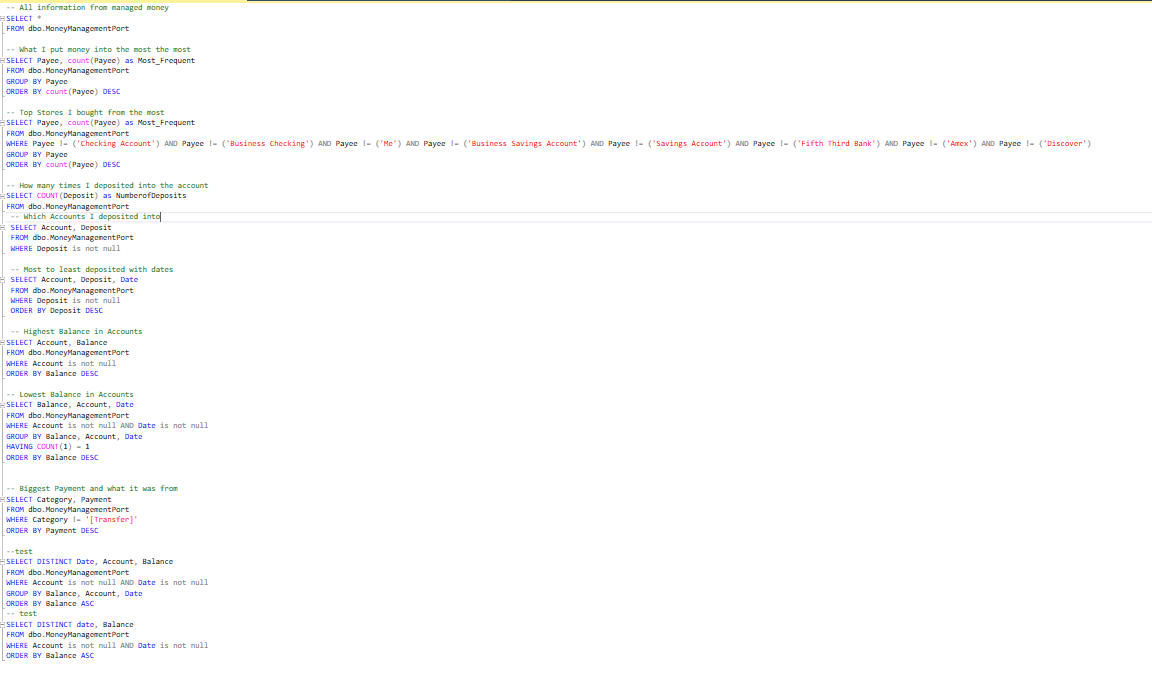
To develop the data visualization, I resulted made multiple queries out of curiosity and relevance to see results of habits.

Around Nine queries were made and five were selected to be used for the most effective information for the project. After the queries were selected, I transferred the information into Tableau to visualize the data.
If more information is wanted feel free to email me : rasheed.jones2@outlook.com